The main goal of the “Sovereign Wikirating Index” (SWI) [1] is to have a transparent, reasonable and comprehensive measure of the creditworthiness of a sovereign entity, which can be directly compared to other countries. Therefore, the selection of available and reliable appropriate data is the most important key factor. Furthermore, the SWI seeks to capture the mid/longterm (3 year time horizon) credit rating of a country, which depict better the behaviour of national economies and the government developments. After all, a country’s credit rating deteriorates or improves slowly over time.
It should be emphasized that the SWI does not claim the sole authority to create the ‘right’ credit ratings for sovereign nations, but to offer an alternative view [2].
Methodology
The first version of the SWI was introduced as the Wikirating platform went ‘live’ 8 years ago. This rating model uses publicly available economic data mostly from IMF[3] and from the World Bank[4] to evaluate a credit rating. Beside 5 mid-term economic indicators (Public Debt, Account Balance, GDP growth, Inflation Rate (or Consumer Price Index) and Unemployment Rate) also 3 long-term ‘scaling factors’ (not to be seen as a ‘calibration factors’) were used in the first version, the Human Development Index (HDI)[5], the Corruption Perception Index (CPI)[6] and the Political Instability Index (PII)[7], all of which (as a proxy) reflect the general level of development of each country.

si and wj are weighting factors, with
![]()
![]()
Econj are the economic indicators and Calib is a calibration factor which normalize the values between 0 and 100, which then are mapped to the credit rating scale from D to AAA.
Since then the PII had to be replaced by the Economic Freedom Index (EFI)[8], as the data of the PII have not been updated any more since 2010. Moreover, the credit rating outlooks are also evaluated:

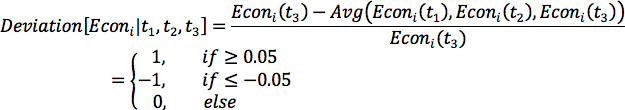 The value 1 means ‘positive’, -1 means ‘negative’ and 0 a ‘stable’ outlook.
Why exactly are these economic factors and indices used? As mentioned before, because of widest possible complete available and reliable data for as many countries as possible in the world, which should represent a good approximation for the credit worthiness of each sovereign nation. One could use other and more criteria, but this would go hand in hand with missing data for many countries in the world, which we want to avoid.
Results
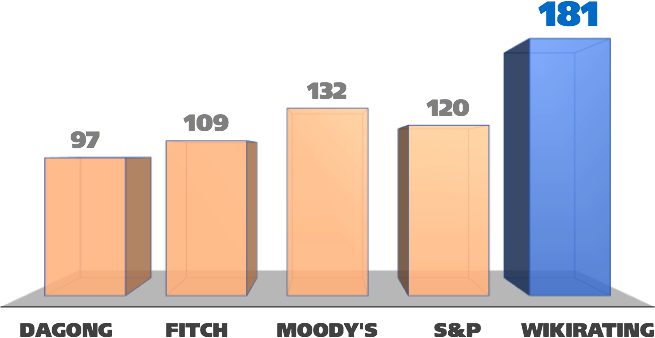
Wikirating has evaluated with the SWI the (long term) credit ratings of 181 sovereign countries – more than any common credit rating agency. The validity of these credit ratings should be seen from 2020 to 2022 (3 years time horizon). Countries, which now have received a low credit rating (below B), have a greater probability to default within this period.
=> List of all Sovereign Credit Ratings
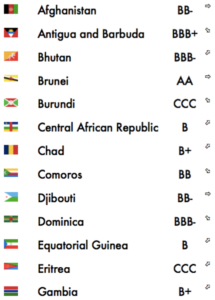
Credit Ratings for Developing Countries
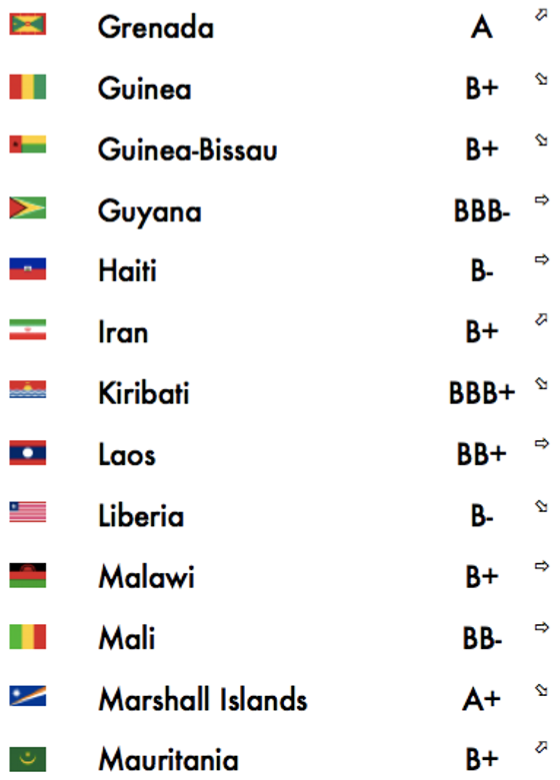
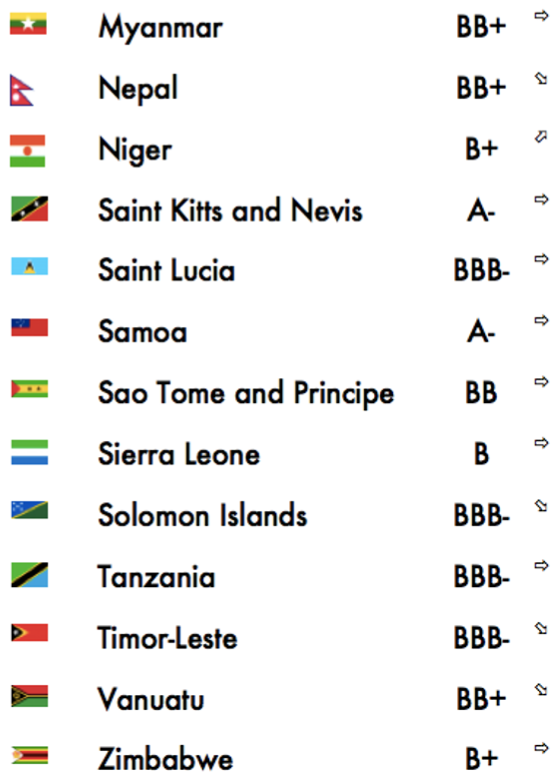
Based on this method, 39 countries – practically all Developing and Least Developed Countries – received a credit rating only from Wikirating. This can be seen as a contribution to support these countries in their development of their public finances.
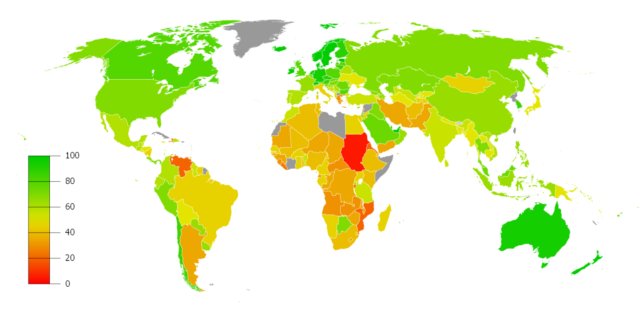
What is the Credit Rating of the World?
About 90% of all sovereign territories in the world (most of them members of the UN, autonomous regions, such Channel Islands or Bermuda, are not counted) have been rated by the SWI, representing more than 99% of the global debt. A “World Credit Rating” would receive a BBB+, which means ‘investmentgrade’.
Sovereign Credit Ratings with one missing Scaling Factor
There are 12 countries (Antigua and Barbuda, Belize, Fiji, Grenada, Iraq, Kiribati, Marshall Islands, Federated States of Micronesia, Saint Kitts and Nevis, Samoa, South Sudan, Yemen), where either the CPI or the EFI are missing. Therefore, here the final credit rating cannot completely be compared to the other countries, where all scaling factors are available.
Comparison between SWI and “The Big Three”[9]
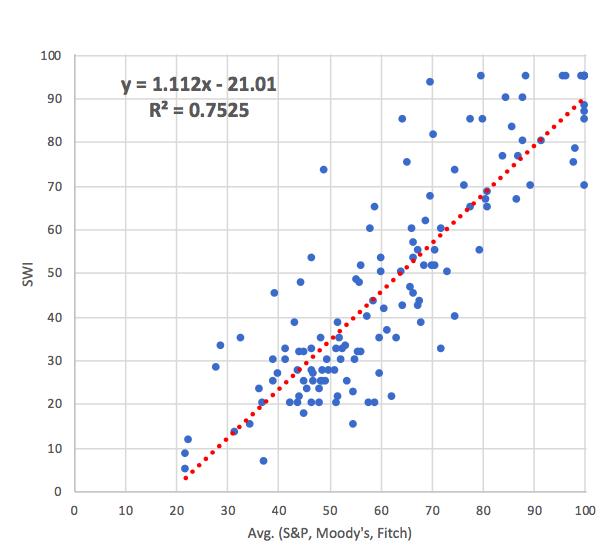
When we compare all SWI results with the ones of the big three credit rating agencies, we see that there is a linear correlation:
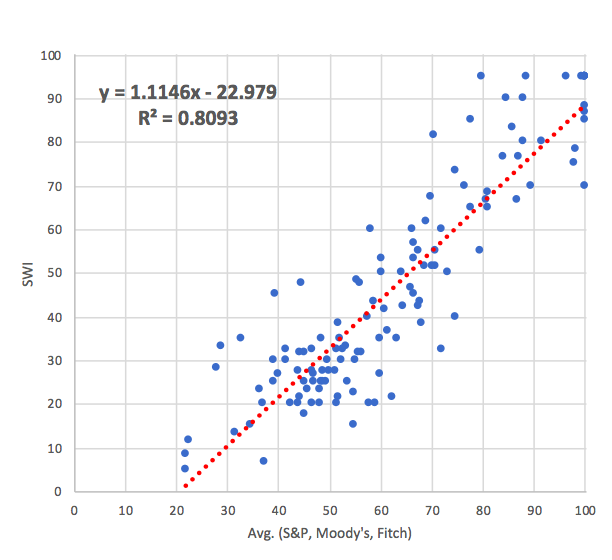
The correlation becomes better, if we remove the 10 most indebted economies (in USD PPP (Purchasing power parity): US, China, Japan, India, Brazil, Italy, France, UK, Germany, Spain):
What does this mean? The results show that the SWI estimates the credit ratings of most of these indebted countries significantly worse than S&P, Moody’s and Fitch:
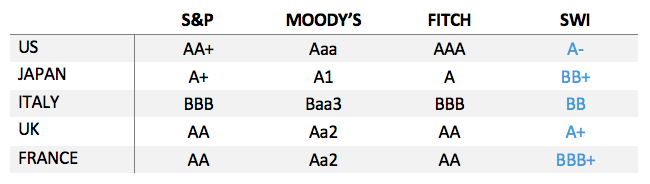 These countries are all members of G7 (Group of Seven), only Germany and Canada are missing. The former because the SWI credit rating is AA+ and the latter because their debt is not in the top 10). In contrast, the SWI results for Brazil, India and China instead are nearly the same compared to the ‘Big Three’. Since the SWI applies the same logic for all countries in the same way, this outcome is surprising. Of course, the selection of economic criteria can be challenged, eg for Japan and Singapore most of the public debt is domestic and for China it is suspected that there is a relevant amount of ‘hidden debt’ which is not factored in the official numbers. One could argue to use other or more criteria to better reflect the ‘real situation’ (compared to what reality?). But this does not explain the big difference, since there are other highly developed countries such as the Netherlands, Sweden or New Zealand, where the SWI results are the same compared to S&P an Co. Is there therefore a bias for the so called ‘world leading advanced economies’?
‘Outliers’ – compared to S&P, Moody’s and Fitch
There are results for some countries, which probably only few would have expected. Beside Japan, France and the US, which all received by the SWI a 5 notches lower rating (compared to an average credit rating from the big three), Barbados, Belarus, Ecuador, Fiji, Moldova and Seychelles received much better ratings (7 or 8 notches more, that is about 2-3 credit rating classes better, eg instead of a ‘B-’ rating the country received a ‘BBB+’ rating).
Summary
With the SWI it is possible to analytically calculate a credit rating for each country in world – as long the appropriate data is available. With the actual data this is possible to do this with 181 countries (of which 39 countries received only a credit rating from Wikirating). Moreover, the results from the common rating agencies can be better checked and questioned. We also have seen that there might be (still) a ‘advanced economies’ bias for their credit ratings, despite the regulations since the financial crisis 2008.
Further articles regarding the SWI and its results will be published in the near future.
[1] Wikirating: https://www.wikirating.com/wiki/SWI
[2] Please note: Values of credit ratings of the SWI can only be used under the Creative Commons Attribution-NonCommercial-NoDerivs 3.0 Unported License
[3] IMF: https://www.imf.org/external/datamapper/datasets/WEO
[4] World Bank: https://data.worldbank.org/
[5] United Nations Development Programme: http://hdr.undp.org/en/data
[6] Transparency International: https://www.transparency.org/files/content/pages/2018_CPI_FullResults.zip
[7] The Economist Intelligence Unit: http://viewswire.eiu.com/site_info.asp?info_name=instability_map&page=noads
[8] The Heritage Foundation: https://www.heritage.org/index/excel/2019/index2019_data.xls
[9] The biggest credit rating agencies S&P, Moody’s and Fitch are sometimes called “The Big Three”, see https://en.wikipedia.org/wiki/Big_Three_(credit_rating_agencies)
Disclaimer: The Sovereign Wikirating Index (SWI) and this article are not intended to be a source of financial advise for investments.